VIA Take Part
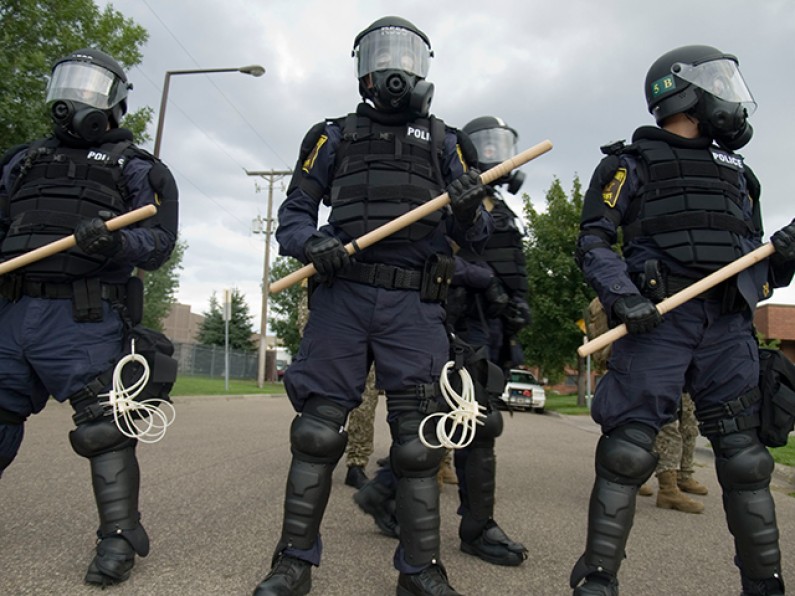
Man in street in Ferguson, Missouri. (Photo: Scott Olson/Getty Images)
Like many Americans, Sam Sinyangwe had a lot of unanswered questions after black teen Michael Brown was shot and killed in Ferguson, Missouri, last summer by a white police officer. The 24-year-old knew unarmed black people were being killed by police across the country, but he didn’t know how many, or where it happened the most.
There is no comprehensive national database of police killings. As a data scientist and activist, Sinyangwe wondered how advocates and policy makers could engage in any sort of meaningful conversation without those basic facts. On top of professional curiosity, Brown’s death hit home for Sinyangwe, who kicked around soccer balls growing up in the Florida neighborhood where Trayvon Martin was killed by gunfire.
“As a young black man, I felt unsafe,” Sinyangwe told TakePart. “This was happening everywhere—not just in Ferguson. Yet we didn’t really have the data to show how widespread this issue was, and how black people in particular are being targeted by police violence.”
Sinyangwe turned to the numbers that did exist. As a policy analyst at PolicyLink in Oakland, California, a research institute that works to advance economic and social justice, he is no stranger to data sets. He started with deaths tracked by the Bureau of Justice Statistics and the FBI but found that they significantly undercounted the victims, excluded location, and didn’t always include race. He overlaid the two data sets and then turned to crowdsourced databases created by journalists and advocates who were disturbed by the lack of data collected by the government, such as Fatal Encounters and Killed by Police. While existing sites offered a richer variety of information than government sources, they didn’t encompass as many incidents as Sinyangwe hoped to track, and some of the sites weren’t coded by race.
So he and fellow activists DeRay McKesson and Johnetta Elzie, whom he met on Twitter, took on the task of sifting through the combined records to recheck and code every entry. After a few months, Mapping Police Violence was born. The project covers “90 percent of the universe of police killings according to the best research available out there,” Sinyangwe said, including whether or not the victim was armed or unarmed. Last year, the project found, 304 black people were killed by the police; 101 of them were unarmed.
(Infographic: Courtesy MappingPoliceViolence.org)
The numbers they do have paint a grim picture. Black people nationwide are three times more likely to be killed by police, but the odds vary by location. In St. Louis, a black person is five times more likely to be killed by police than in New York. In Oklahoma, if you’re black, you’re 10 times more likely to be killed by police than if you live in Virginia. Sinyangwe plans to reach out to state coordinators that submit this data to the FBI to tell them what they’ve missed.
“Place matters,” Sinyangwe told TakePart. “A black person in St. Louis is more likely to be killed by police than by dying in a traffic accident. This is the level of violence that folks are experiencing, and they have every reason to be afraid.”
The project has already garnered the attention of data experts like those led by elections expert Nate Silver at FiveThirtyEight, and Sinyangwe has appeared on CNN to share his team’s work. They plan to collect and map data back to 2011, with data broken down by city and eventually zip code for a more focused analysis. By highlighting the difference in rates of police violence in certain locations, they hope to motivate elected officials and others to work for measurable change.
Sinyangwe hopes the project will spur a discussion about why the government didn’t collect the data in the first place.
“If I could do this in several months, why haven’t they collected this data?” he said. “This is more than a question of legislation; this is a question of political will.”

